The IDI contains information about the occupations of people in New Zealand from the census and IRD records. The census records information about each person’s occupation and the main industry of their employer as they report it at the time of census (March 2013). IRD records contain information about income received as wages or self-employment each month from 1999 to 2017. The industry of the business paying the income is recorded and we use this to determine which industry each person is working in.
The census allows us to determine both a person’s occupation and the industry they work in. We can use both pieces of information to create a definition of a workforce. The only census available in the IDI is the 2013 census so we only have access to this data at a single point in time. The IRD dataset allows us to track a workforce over time, however it does not give us any information on a person’s occupation, so our definition of a workforce is necessarily broader.
We have two pieces of data available in the census to classify people as workers in a trade sector: industry and occupation. For each sector we need a list of relevant industries and occupations as identified by ANZSIC and ANZSCO codes respectively. Each sector will then consist of various combinations of industry and occupation. The chart below shows how many workers have each combination of industry and occupation where either is relevant to a sector.
Methodology
We can also determine someone’s sector of employment from IRD records. This has the advantage of being trackable over time and providing detailed information about income. IRD records do not have any information about a person’s occupation, however. This limits us to defining a workforce based on their industry only. We can use income thresholds to select the less casual elements of a workforce. For example, we may include only those who earn more than $2500 per month in a sector.
For comparison with the census data, we calculate the size of the IRD-defined workforce for March 2013 (the month of the census). In the chart below we show how the workforce breaks down by income for income thresholds of $500 and $2500 per month. We do not use income thresholds for people earning income from self-employment as their income does not necessarily correlate with time spent working (e.g. they may make a loss).
Some sectors do not have any industries that accurately correspond to them, only occupations. These occupation-defined sectors cannot be tracked in the IRD data. These sectors will have no data when selected in the chart below.
Methodology
We can see how closely the census and IRD definitions of a workforce align with each other by checking how much they overlap during the month of the census. The chart below shows the proportion of those classified by either definition who are classified by each definition. The donut charts show a breakdown of why people were not included in a particular definition.
The exact proportion differ between industries, but the main reason for not being included in a definition is that no record exists either in the census or IRD records. There may be no IRD record because a worker happened to not make any income in the month of the census but was working in the sector in earlier months. Those people who received income in March 2013 but did not appear in the census are more difficult to explain. They will be some combination of people who happened to go overseas during the census, those who did not fill out the census, and those whose census records have not been matched to their IRD records.
Methodology
Census and IRD data give us two complementary ways to define a workforce. Occupation data in the census allows us to create a precise definition of a workforce which is useful, particularly when we are looking specifically at trade roles. IRD data allows us to track a workforce over time, though with less precision. We will use definitions based on both sets of data, choosing each where it is appropriate.
Access to the data used in this study was provided by Stats NZ under conditions designed to give effect to the security and confidentiality provisions of the Data and Statistics Act 2022. The results presented in this study are the work of the author, not Stats NZ or individual data suppliers.
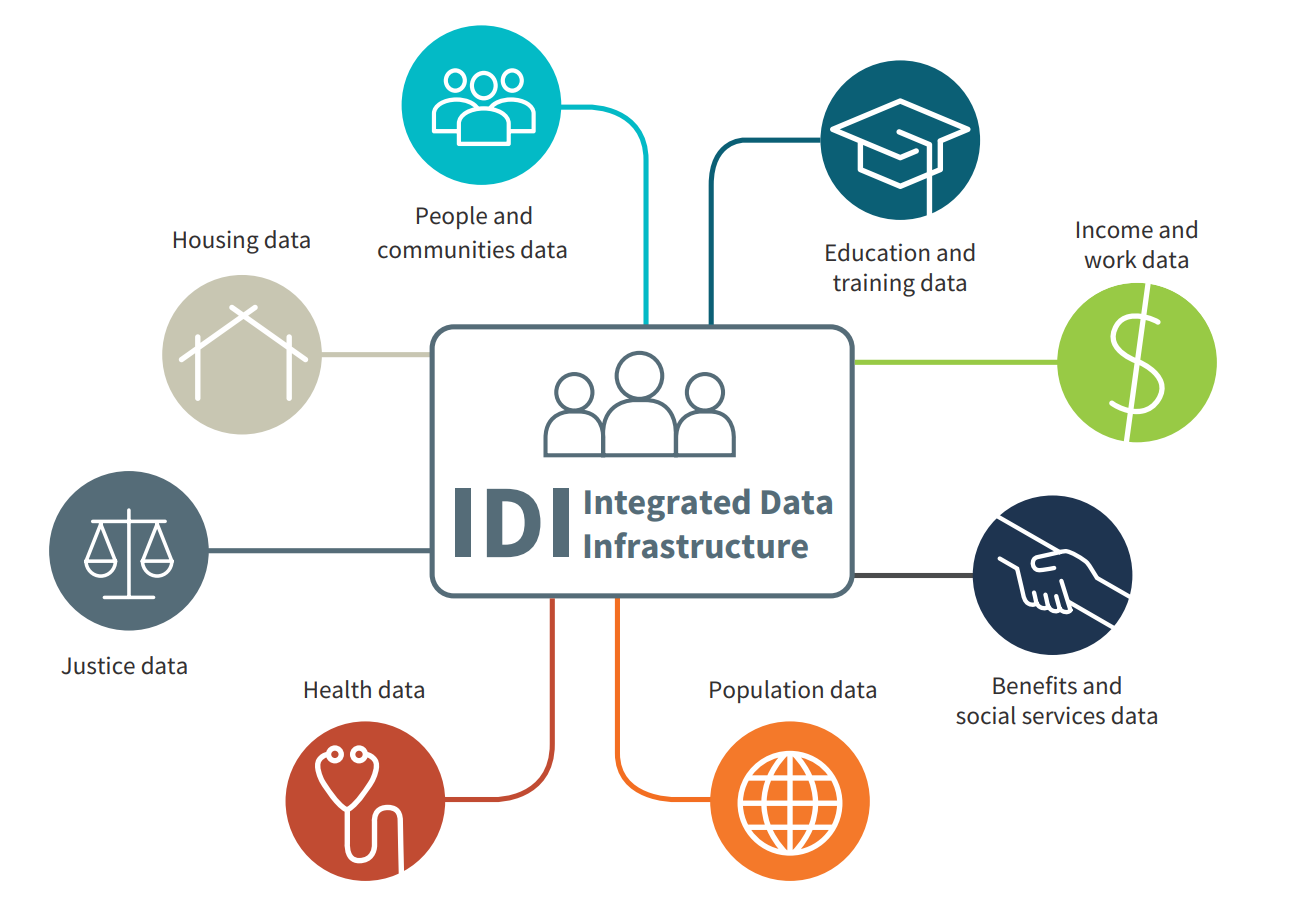
These results are not official statistics. They have been created for research purposes from the Integrated Data Infrastructure (IDI) which is carefully managed by Stats NZ. For more information about the IDI please visit https://www.stats.govt.nz/integrated-data/.
The results are based in part on tax data supplied by Inland Revenue to Stats NZ under the Tax Administration Act 1994 for statistical purposes. Any discussion of data limitations or weaknesses is in the context of using the IDI for statistical purposes, and is not related to the data's ability to support Inland Revenue's core operational requirements.